Key points
– Australian home prices rose again in October, with the supply shortfall on the back of record immigration dominating. Prices are now on track for a 9% gain this year.
– While the supply shortfall is likely to continue there is a high risk that the impact of high interest rates will start to get the upper hand next year particularly if the RBA hikes again and unemployment rises by more than expected.
– Price gains are expected to slow to 5% next year, but the risk of another leg down in prices next year is high.
Introduction
The big surprise in the Australian housing market last year was how quickly home prices fell with RBA rate hikes. But the big surprise this year is how they rebounded when most including myself were looking for further falls. October CoreLogic data showed another 0.9% rise in national home prices, leaving them just 0.5% below their April 2022 record.
Australian dwelling price growth, to October
| Oct % chg | Annual % chg | % recent peak to low | % recent low to now | ||
| Sydney | 0.8 | 9.0 | -12.4 | 11.6 | |
| Melbourne | 0.5 | 2.4 | -7.9 | 4.5 | |
| Brisbane | 1.4 | 7.8 | -8.9 | 10.5 | |
| Adelaide | 1.3 | 6.5 | -1.7 | 7.7 | |
| Perth | 1.6 | 10.8 | -0.6 | 11.0 | |
| Hobart | 0.8 | -4.9 | -12.2 | 0.8 | |
| Darwin | -0.1 | -1.7 | -5.1 | 2.5 | |
| Canberra | 0.1 | -1.6 | -7.9 | 1.3 | |
| National avg | 0.9 | 5.6 | -7.5 | 7.6 |
Source: CoreLogic, AMP
After the initial rebound earlier this year we came to the conclusion that prices had bottomed and would rise another 5% next year. This remains our view, but the outlook for the property market is more uncertain than normal as the property market is caught between the extremes of a supply shortfall and the negative impact of higher interest rates – both of which are still playing out and are getting more extreme.
Supply shortfall still dominating for now
The rebound in prices reflects a far worse than expected shortfall of supply relative to underlying demand for homes as immigration rebounded driving the fastest population growth rate since the 1950s at the same time that the supply of new dwellings slowed. This accentuated already tight rental markets, forcing rents up & driving renters to consider buying. So, demand improved but supply remains weak with total listings below normal. Talk of rising prices and shortages further boosted demand from less interest rate sensitive buyers. Expectations that rates were at or close to the top have also helped. Looking at the key elements of this:
- Net immigration looks to have been around 500,000 in 2022-23, more than double the 235,000 forecast in last October’s budget. And monthly arrivals suggest it’s continuing to surge this financial year.
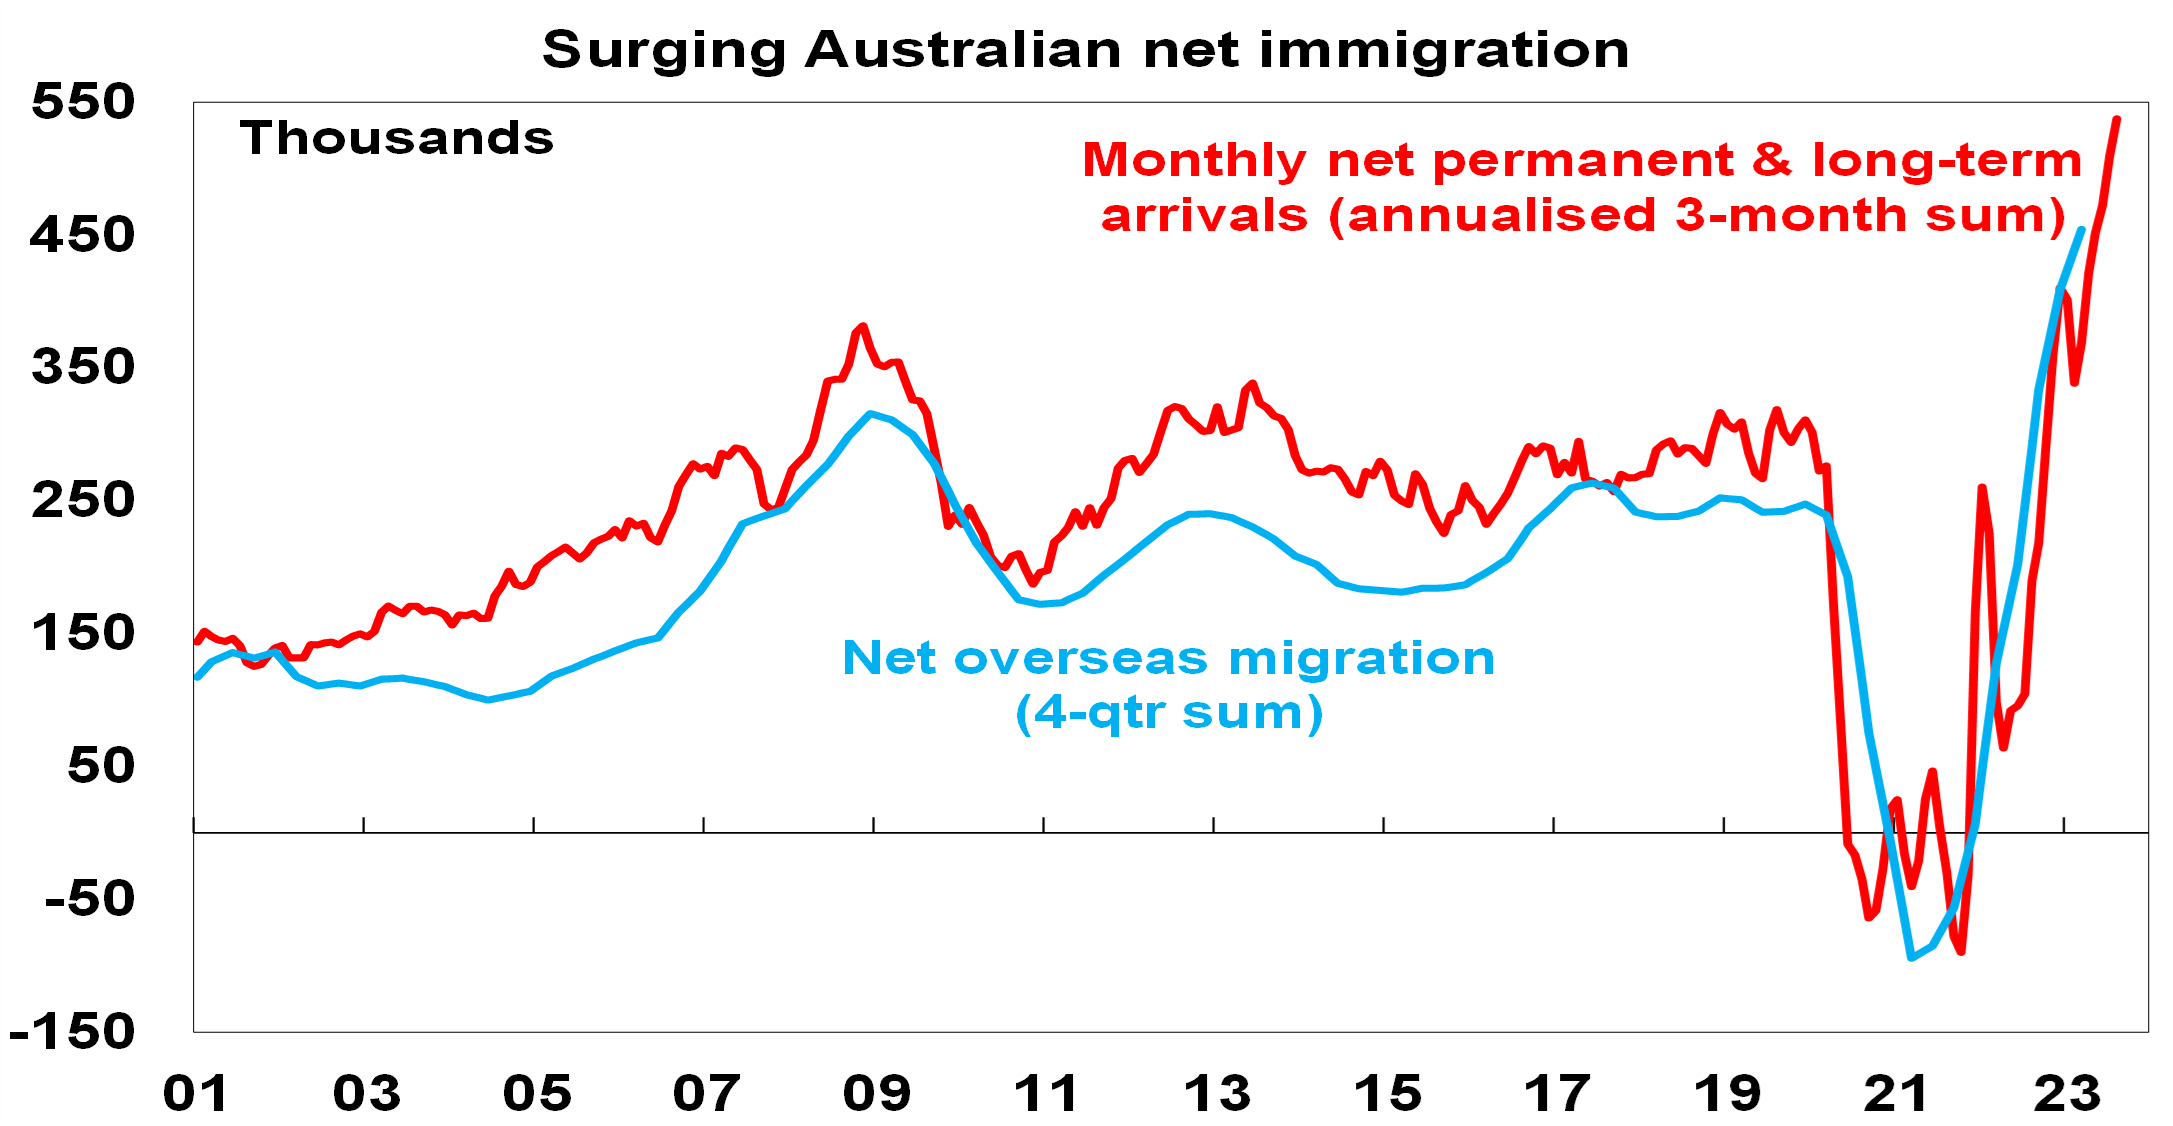
Source: ABS, AMP
- This along with the constrained completion of new homes (with material and labour shortages and falling approvals) has meant an ongoing rise in the accumulated undersupply of housing, estimated to be 120,000 dwellings, rising to 190,000 dwellings by mid next year.
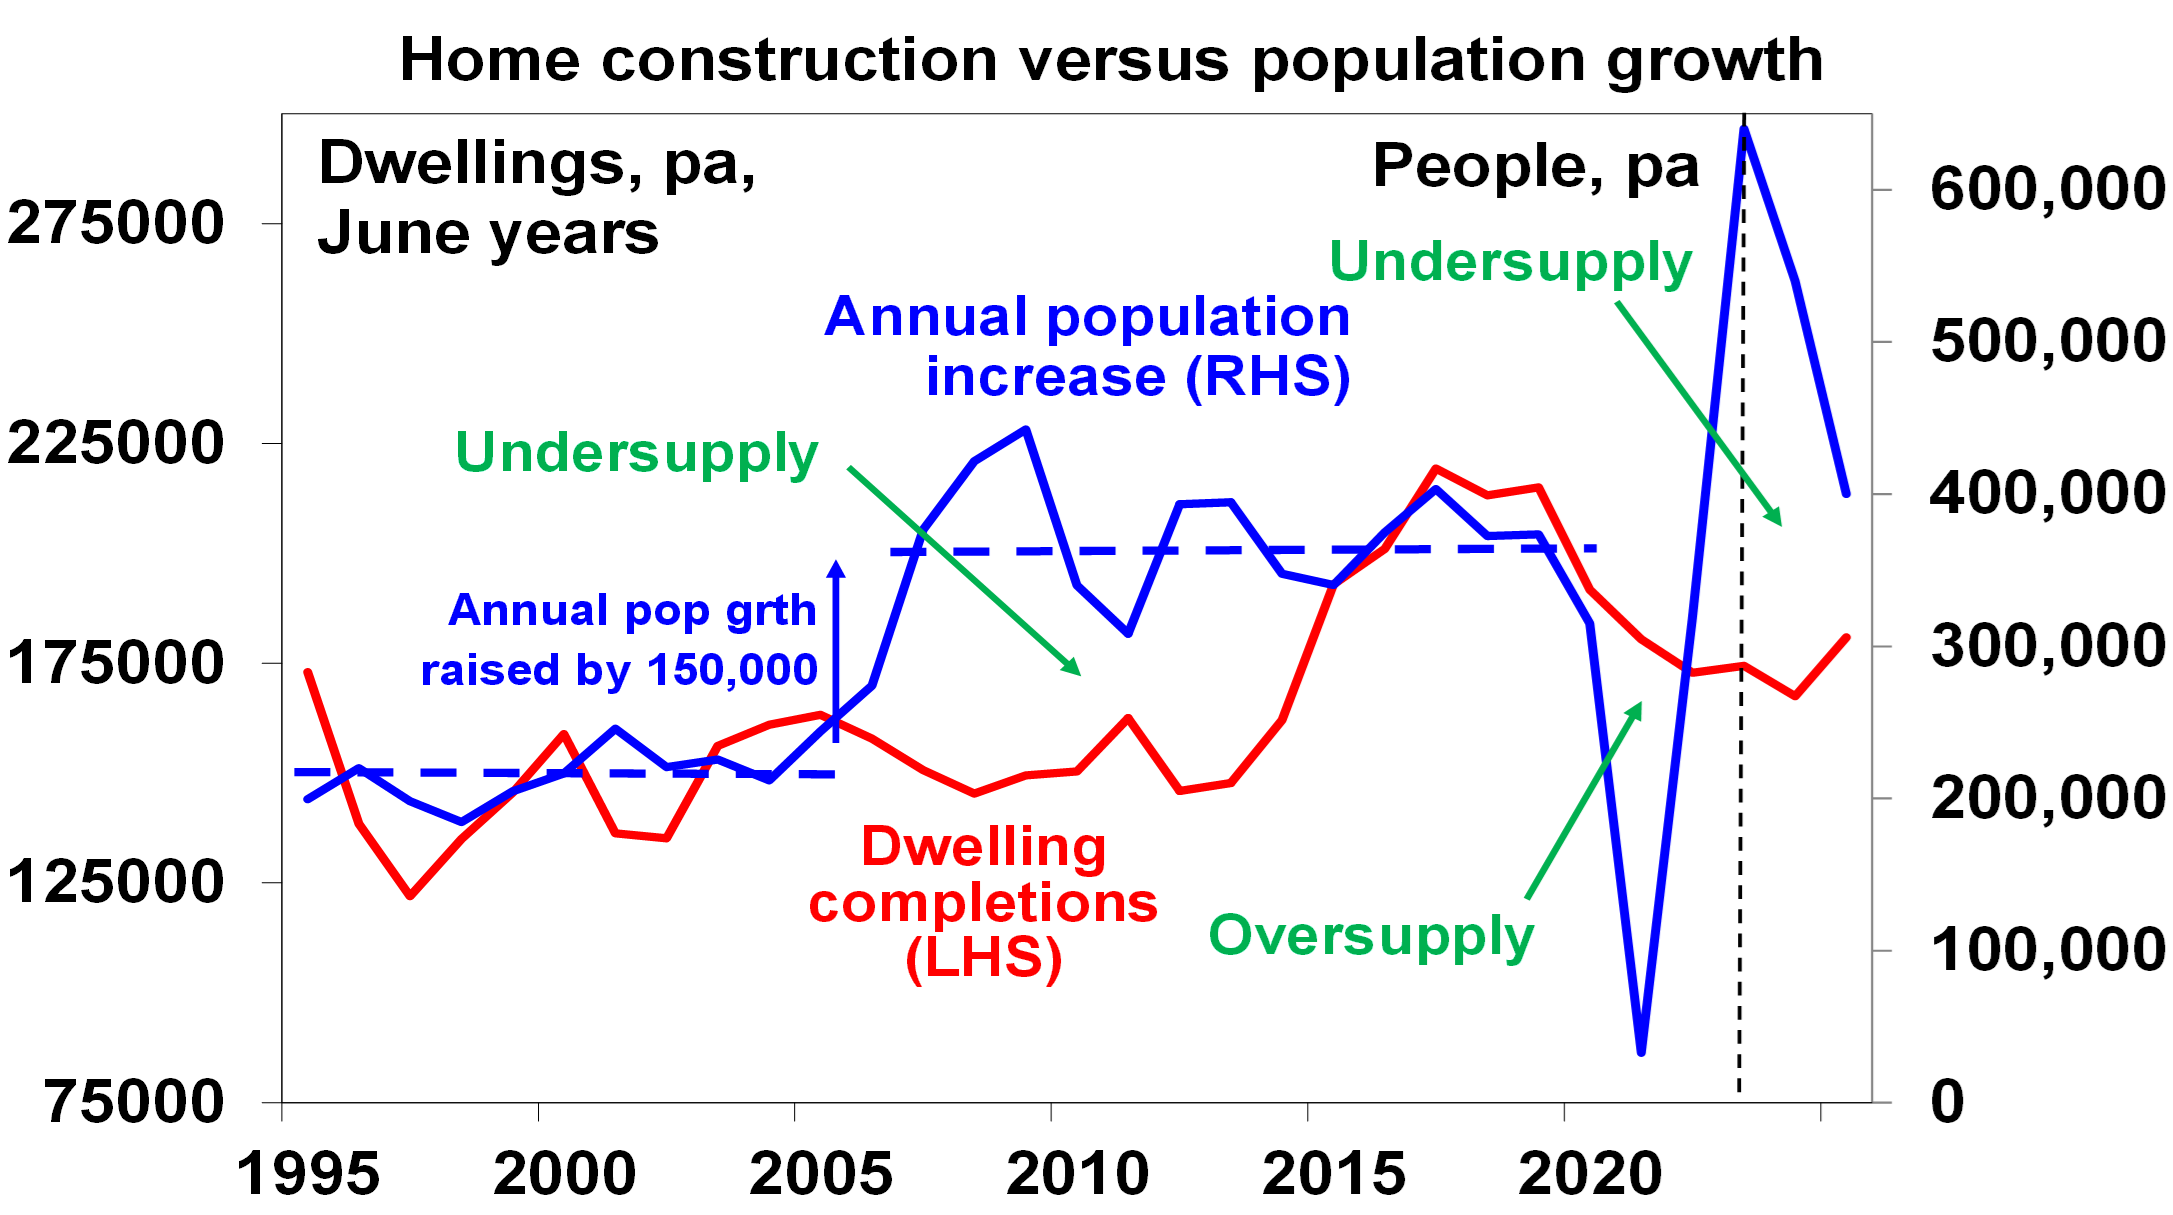
Population estimates based on recent data for 2022-23 and 2023-24, then Australian Budget forecasts for 2024-25. Source: ABS, Australian AMP
- The Government’s commitment to produce 240,000 dwellings a year over five years is great news but only starts from July 2024 and may struggle as we only completed 187,000 pa over the last five years.
- Tight housing supply is reflected in record low rental vacancy rates and surging rents, which in turn is driving some to try and buy.
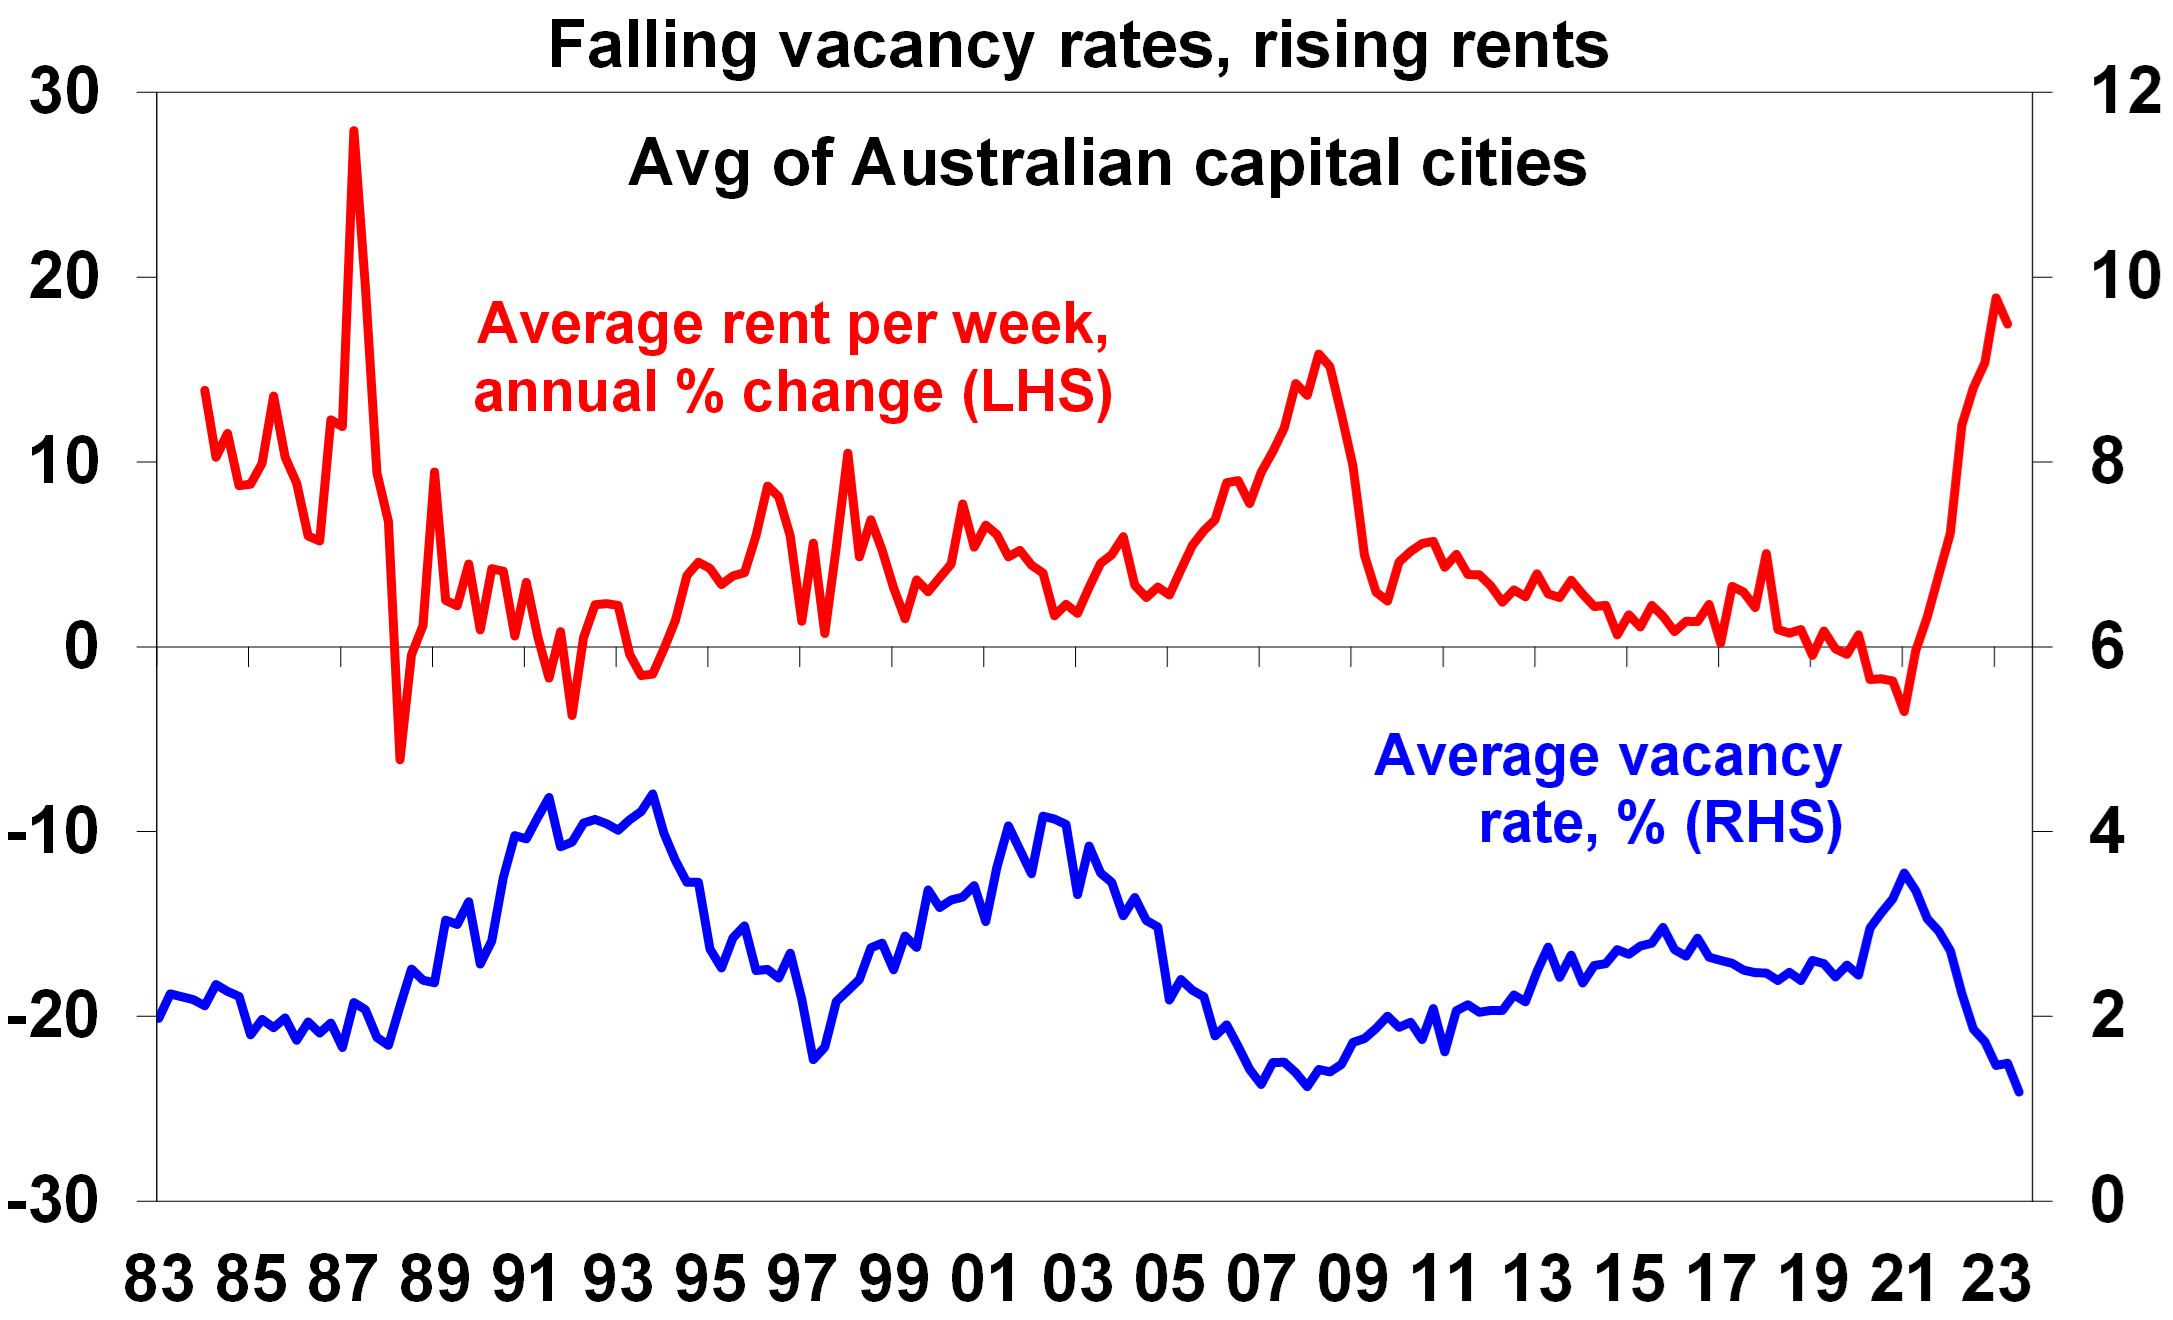
Source: REIA, AMP
So strong population driven housing demand, constrained supply and an existing shortfall remains a strong source of support for home prices.
But high rates may start to get the upper hand again
However, even when there is a supply shortfall, interest rates still matter.
- The long-term bull market in property prices from the 1980s was underpinned by the shift from high inflation and high interest rates to low inflation and low interest rates which allowed a rise in home price to income levels and a similar rise in household debt. This valuation effect boosted house prices by around 3.3% pa, accounting for 46% of the total increase in house prices since the early 1980s. So, if we have moved into a more inflation prone world with higher average interest rates this structural boost has run its course & could start to reverse.
- Australian housing remains very expensive on all metrics – home price to income ratios are only just below record highs; they are at the high end of comparable countries; and the time taken to save for a 20% deposit has more than doubled over the last 40 years from less than 5 years to now more than 10.
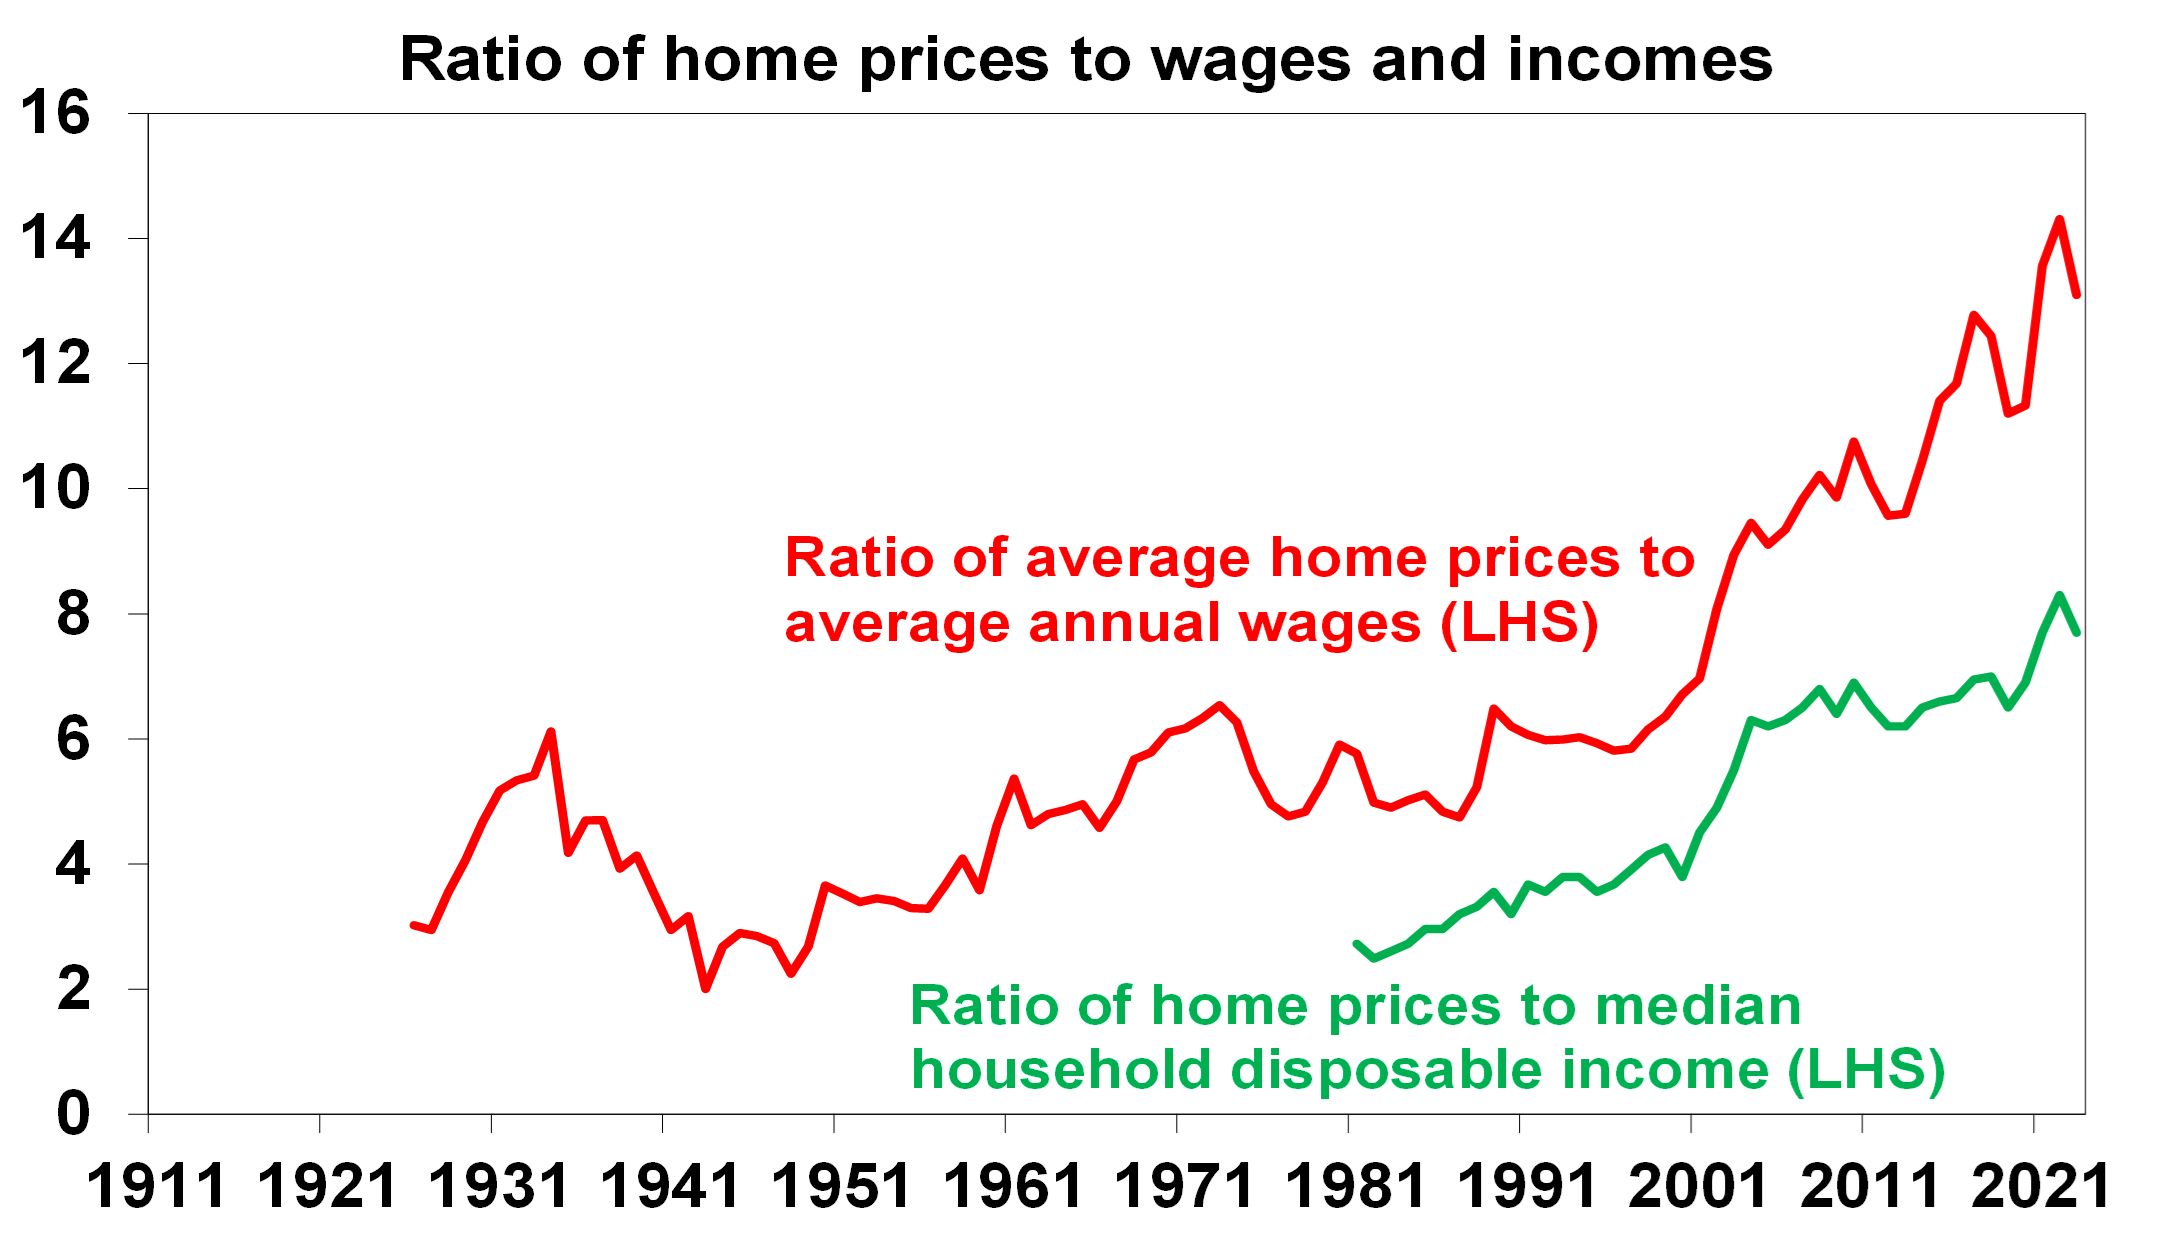
Sources: ABS, CoreLogic, AMP
- The rise in interest rates since May last year has caused a big hit to home buyer “capacity to pay”. We estimate that the capacity to pay for a home by a borrower with a 20% deposit on full time average earnings is around 29% lower than it was in April last year as they can’t borrow as much now on a given income. See the next chart. This threatens a downwards adjustment in home prices at some point unless incomes rise dramatically or mortgage rates fall dramatically. It may have been offset this year by a pool of less interest sensitive buyers (eg, those who had access to the bank of Mum and Dad) but that leaves the market vulnerable if such buyers are exhausted.
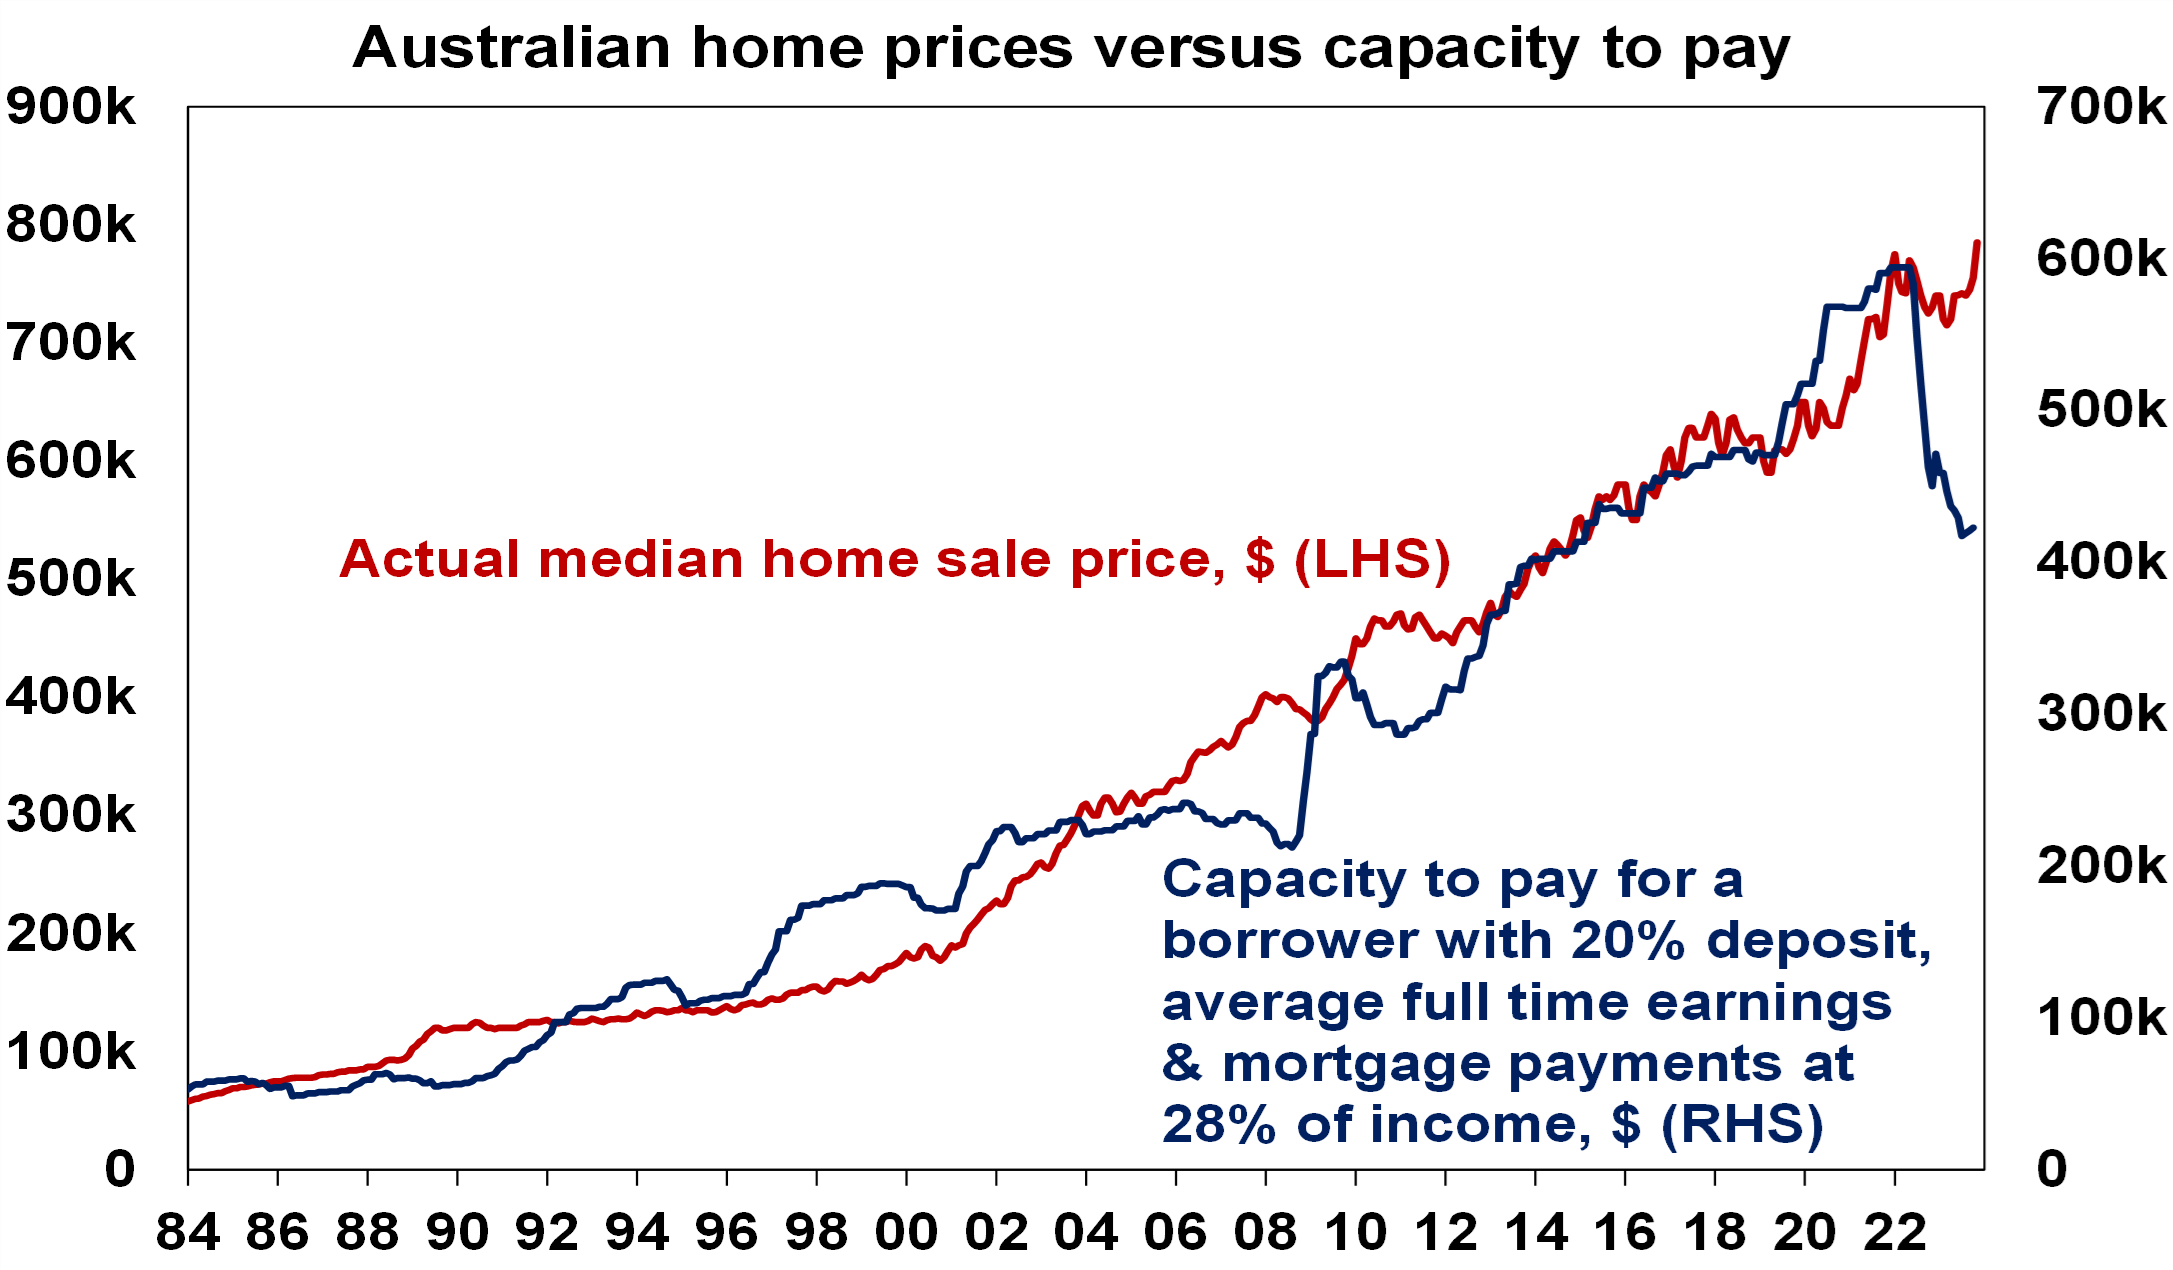
Source: RBA, CoreLogic, AMP
- Australians continue to see this as a poor time to buy homes consistent with very depressed levels of consumer confidence generally. This makes the current upswing in home prices unusual as it’s normally accompanied by improved sentiment towards property.
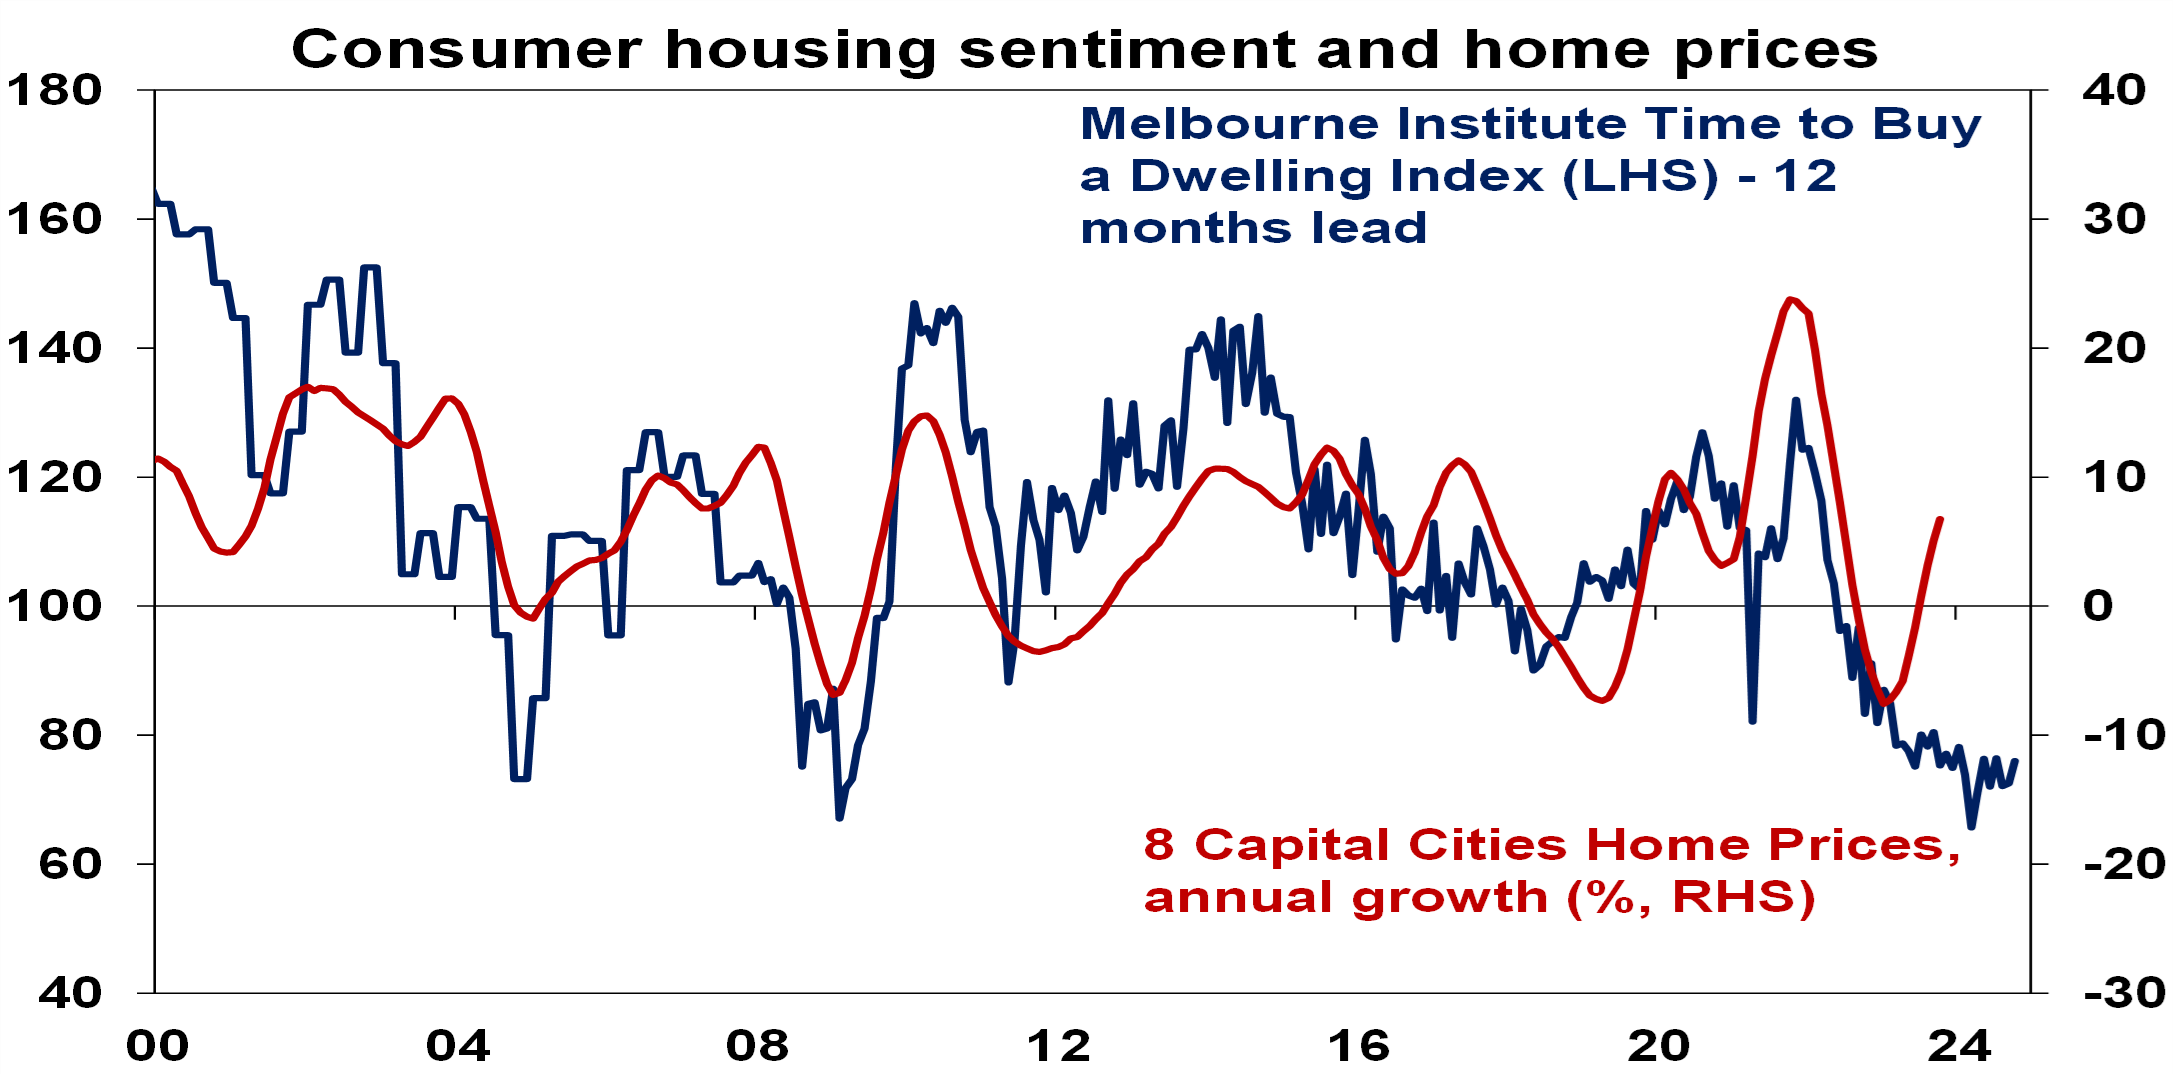
Source: Westpac/Melbourne Institute, CoreLogic, AMP
- New listings are trending up and are likely to be boosted by increased listings from distressed sellers, including investors with rental yields falling further below mortgage rates. Measures of mortgage stress are continuing to rise. Mortgage interest payments as a share of household income are rising to record levels and scheduled payments are already at a record according to the RBA. And combining the RBA’s own analysis for variable and fixed rate borrowers one in seven home borrowers were estimated to be in negative cash flow as at July. This will worsen if the RBA raises rates further as appears likely.
- Just as rate hikes impact the economy with a lag it’s the same with the property market. This is because it takes time for rate hikes to cool demand, for unemployment to rise and for distressed sales to increase. So last year’s slump in property prices that started as soon as interest rates started to rise maybe ran ahead of itself. Similarly, the last three major cyclical upswings in home prices have required lower interest rates to be sustained. With rates cuts still a long way away, the impact of past rate hikes still feeding through to demand and listings, and the RBA looking like it will raise rates again, the risk of another leg down in prices is high.
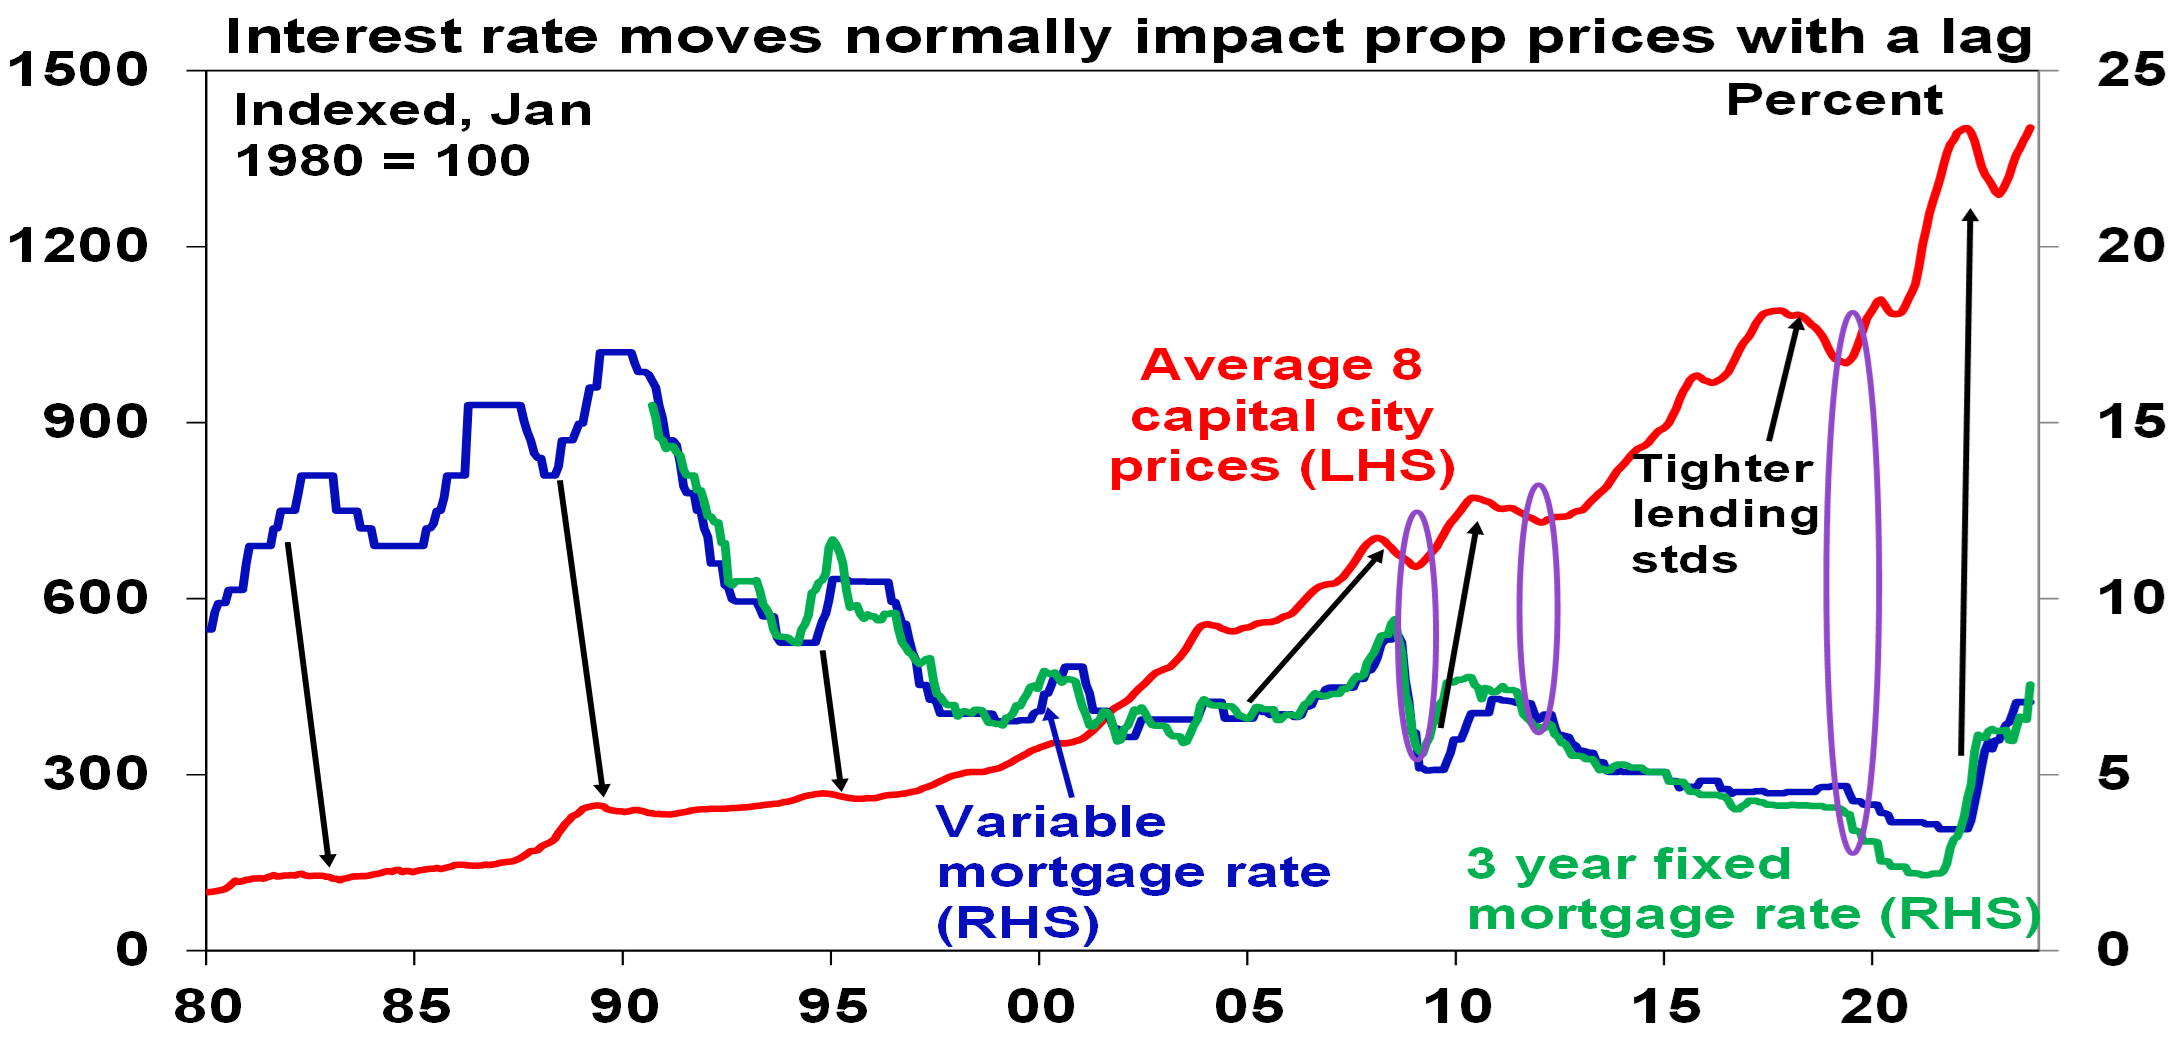
Arrows show the lagged lead from rate hikes to price falls. Source: CoreLogic, RBA, AMP
Concluding comment
The combination of slowing home price growth since May (when it peaked at 1.2% month on month), slowing auction clearance rates from the low to mid 70% range to the low to mid 60% range and weak growth in housing finance suggest that housing demand is struggling to keep up with listings. The supply shortfall in the face of strong demographic demand has had the upper had this year but high interest rates and their lagged impact look to be starting to reassert themselves. The headwinds of high interest rates and poor affordability will likely constrain the upswing at the very least and so our base case remains for price growth to slow to 5% next year. But it also means there is a very high risk of another leg down in average home prices emerging next year, particularly if unemployment rises significantly. After surprising on the upside this year, they may surprise on the downside next year! Interest rates, unemployment and auction clearance rates are key indicators to watch.
What you need to know
While every care has been taken in the preparation of this article, neither National Mutual Funds Management Ltd (ABN 32 006 787 720, AFSL 234652) (NMFM), AMP Limited ABN 49 079 354 519 nor any other member of the AMP Group (AMP) makes any representations or warranties as to the accuracy or completeness of any statement in it including, without limitation, any forecasts. Past performance is not a reliable indicator of future performance. This document has been prepared for the purpose of providing general information, without taking account of any particular investor’s objectives, financial situation or needs. An investor should, before making any investment decisions, consider the appropriateness of the information in this document, and seek professional advice, having regard to the investor’s objectives, financial situation and needs. This article is solely for the use of the party to whom it is provided and must not be provided to any other person or entity without the express written consent AMP. This article is not intended for distribution or use in any jurisdiction where it would be contrary to applicable laws, regulations or directives and does not constitute a recommendation, offer, solicitation or invitation to invest.
The information on this page was current on the date the page was published. For up-to-date information, we refer you to the relevant product disclosure statement, target market determination and product updates available at amp.com.au.